


The introduction of cardiac electroanatomic mapping systems in the mid-1990s has permitted investigators to record intracardiac electrograms (EGMs) with accurate spatial localisation in 3D.1 These 3D mapping systems have enabled the display of the cardiac chambers as an anatomical shell upon which voltage, or activation, information can be displayed. Most commonly, colour is used to represent the variation of a single parameter that has been derived from the EGM at each sampled location. Typically, the local activation time (LAT) is interpolated across the shell to create an isochronal map.2
3D mapping is an established tool in the identification of arrhythmia mechanisms, as well as in the localisation of anatomical sites critical to arrhythmia maintenance as a guide to ablation.3 However, there is little objective evidence about the efficacy of these techniques. Current methods of mapping atrial tachycardia (AT) or ventricular tachycardia (VT), as well as their substrates, are not without limitation.4 First, data interpolation algorithms used by 3D mapping systems assume that data between two mapped points are uniform. However, in scar tissue where activation is not continuous, these estimates can lead to error.2 Second, identification of the mechanism relies on isochronal maps in which LAT is compared with the timing of a stable reference signal, such as the surface ECG for VT or an EGM from the coronary sinus in AT. The measurement of this timing is plotted according to a colour scale. Only a single activation time can be annotated for each EGM. Complex EGMs with low amplitude, long and fractionated potentials are often encountered in low-voltage myocardium and can be important indicators of deranged conduction over tissue critical to the maintenance of arrhythmias.5 Incorrect assignment of LAT of only a single EGM can give rise to misleading activation maps, even when high-density mapping is used.6 Third, a timing window of interest (WOI) must be created, to ensure that EGMs from the same beat are compared, by specifying a time interval both before and after the reference point. The operator must choose this WOI appropriately. Different WOIs influence the isochronal colour display and this can lead to difficulties interpreting the arrhythmia mechanism.7
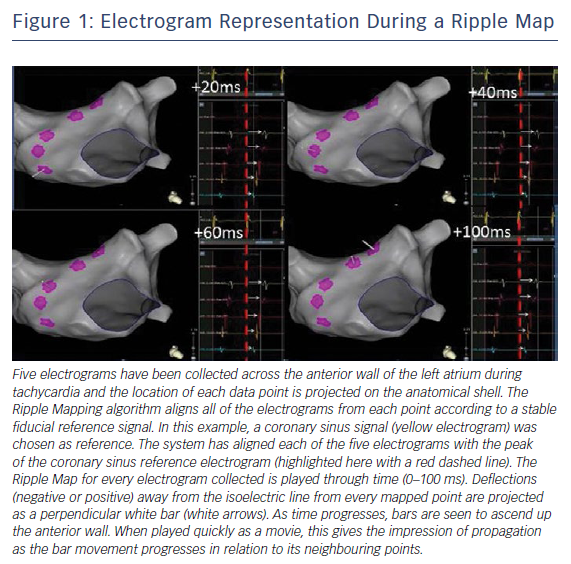
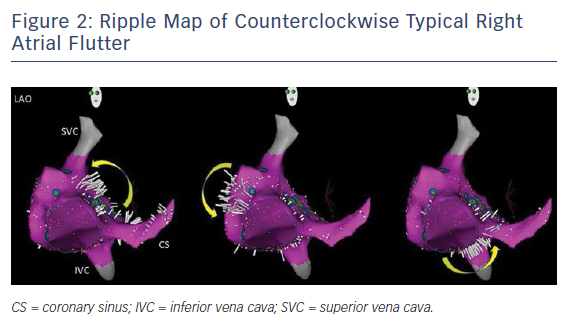
Ripple mapping (RM) was introduced as a different method of 3D EGM visualisation to ameliorate the limitations faced by conventional 3D mapping techniques. EGMs are aligned according to a stable reference point and displayed in their entirety as dynamic bars that protrude perpendicularly from the chamber geometry. The length of each bar, at a particular time relative to the reference, is proportional to the magnitude of each EGM at that time.8 Following collection of multiple EGMs, the endocardial activation sequence can be appreciated by the movement of each bar relative to its neighbour, creating a ripple effect (Figure 1 and Figure 2).9,10 RM avoids the need to annotate EGM activation time and does not require setting of a WOI. Only acquired points are displayed on the ripple map so there is no data interpolation in the generation of the map. In the same way as a decapolar coronary sinus catheter will have an earliest and latest EGM, a ripple map will have bars that move early or late relative to the reference EGM, but in 3D. The operator can infer that the direction of activation will be from the earliest moving bars to the latest moving bars. This pattern of activation becomes more obvious as the number of bars increases; typically for atrial arrhythmias 1,000–2,000 points will produce an effective ripple map. If a LAT map is collected with 50 points, standard automated algorithms will ‘fill in’, with colour, the spaces between (interpolation). This is not real data; it assumes the activation is uniform and predictable between points. This may be acceptable in healthy myocardium but in scarred tissue it will create a false map. If the same data are played as a ripple map, the sparsity of points makes it difficult to determine the direction of wavefronts and, in effect, prevents the operator from interpreting an inadequate map. Conversely, ensuring local time annotation is correct with 2,000 points is challenging, but not necessary with a ripple map. RM preserves the entire voltage–time relationship of an EGM. Myocardial areas central to arrhythmia mechanisms, such as scar, often display EGMs with low amplitude, fractionated and double potentials. Such EGM information can be lost in traditional voltage or activation maps because only a single value – of timing or voltage – is assigned to an EGM in creating the map.
A fractionated EGM can be tagged on an activation or bipolar voltage map as a region of interest because it represents slow conduction. In a ripple map, the bar at a fractionated EGM will appear to move continuously with low amplitude over the entire duration of the EGM. However, RM contextualises the fractionated EGM with respect to surrounding tissue. For example, if the point is at a slow conducting isthmus, a ripple map will show the bar starting to move when the late portion of the re-entrant circuit reaches the isthmus and it will continue to move until the breakout of the earliest part of the re-entrant circuit. Furthermore, if it is a long isthmus, such as with an ischaemic VT diastolic pathway, there will be early and late fractionated EGMs that will demonstrate the direction of activation if viewed as a ripple map. Simple fractionated EGM mapping by tagging cannot do this. Using RM to define the activation direction within the diastolic pathway of ischaemic VT can also differentiate between the central common pathway and blind alleys, which cannot be done with simple fractionation mapping.
In certain atrial arrhythmias scar may be present throughout the atrium. Complex and fractionated EGMs may therefore occur in many areas not critical to arrhythmia mechanism. Simple fractionation mapping cannot differentiate between areas that are critical to the circuit and those that are bystanders. However, all areas will cause problems for LAT assignment algorithms. As RM does not assign a LAT, it is less susceptible to such errors. Fractionation tagging can help to direct the operator to regions that need manual LAT validation, but in high-density mapping, with more than 1,000 points, this can be labour intensive during an already complex procedure.
RM is unique because it is not obligatory for the anatomical shell to be coloured. This means that colour can be used to display other information, such as data from MRI. However, we have found that simultaneous display of the bipolar EGM voltage is helpful in interpretation of ripple map activation, particularly when understanding arrhythmia mechanisms and their relation to scarred substrates.11,12
RM has been incorporated into a commercially available electroanatomic mapping system, CARTO® 3 (Biosense Webster), so it can be used to guide ablation at the time of mapping. In the following sections we will review our experience of RM in elucidating the mechanisms of tachycardia within atrial and ventricular scar.
Ripple Mapping in Atrial Tachycardia
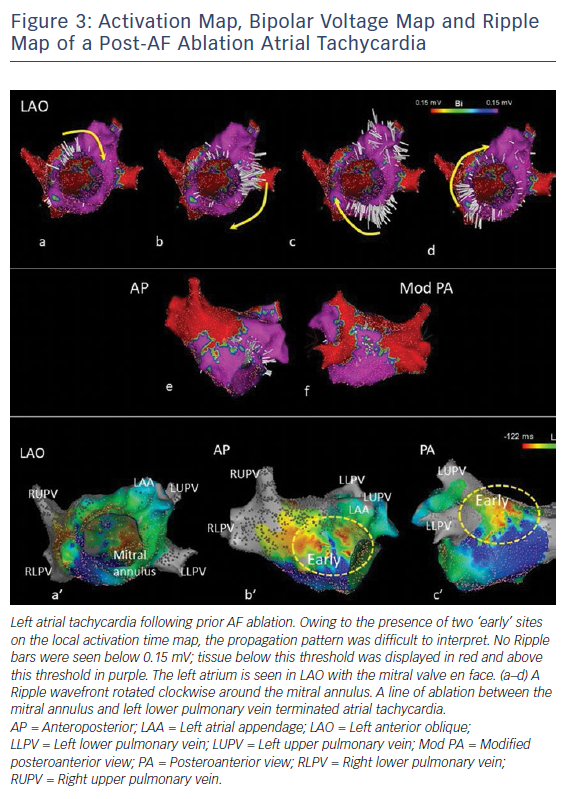
ATs often occur in patients with prior AF ablation. As well as pre-existing tissue abnormalities, ablation creates scar tissue forming a substrate for re-entry.13 AT mapping aims to define this re-entrant circuit within areas of low voltage and slow conducting tissue. Conventional mapping of these arrhythmias can be misled by misannotation of LAT or incorrect settings of the WOI. Early studies using RM demonstrated the potential for improved accuracy in determining the arrhythmia mechanism, compared with conventional mapping, by overcoming these limitations.9,10 We described active tissue thresholding, which helps to define the critical isthmus sites supporting re-entry as a target for ablation: by superimposing ripple activation on a bipolar voltage display, areas without any visible ripple activation can be inferred to be scar and colour-coded red on a voltage map.11 An example of this is illustrated in Figure 3 for mapping an organised AT in an atrium with previous extensive ablation for AF, where the local activation colour sequence is uninterpretable.
There is no consensus on the voltage threshold that defines atrial scar, unlike in the ventricle where scar has been defined as a voltage below 0.5 mV.4 In a 20-patient study examining RM in post-ablation ATs, operators were able to map the conducting atrial circuit around scar – by defining scar as tissue without ripple propagation – to identify the optimal site for ablation in all cases.11 However, changes in bipolar voltage amplitude can occur with changes of atrial activation sequence owing to the anisotropic characteristics of cardiac tissue, or when variation of atrial activation sequence leads to wavefront collision.14 Further studies have demonstrated that scar distribution in the ablated atrium is generally fixed. This may offer a future means of substrate-guided ablation for AT in the many symptomatic patients who are non-inducible on the day of their procedure or as ‘primary prevention’ at the time of ablation for persistent AF.15
RM looks different from conventional activation mapping, but we have shown that experienced CARTO operators using the system for the first time achieved high diagnostic accuracy and ablation success.16
Ripple Mapping in Ventricular Tachycardia
Scar-related VT is dependent on channels of surviving tissue within the scar that support re-entry. These channels are defined by areas of late activating EGMs (late potentials) and fractionation. Detailed mapping studies of EGMs collected during sinus rhythm within these supposed channels have recorded a gradient of early to late activation, supporting the notion that these channels are interconnected.17,18
EGMs within ventricular scar often have two or more components; the local signal from within scar and the larger far-field signal from the thicker surrounding tissue or the epicardial surface. Mapping of VT and its substrate relies on annotation of the diastolic potential in VT or the late potential in sinus rhythm. Conventional LAT maps only allow one annotation of activation time. This may result in error from misannotating the larger far-field signal as local activation, or errors caused by noise. There is also loss of information if there is more than one late potential.
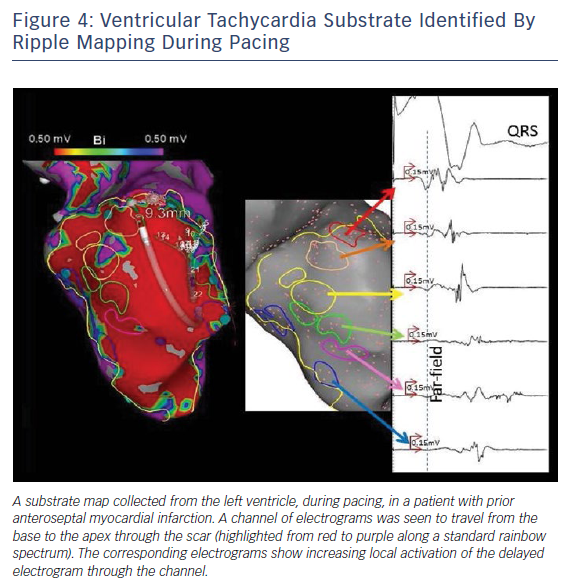
Analysis of VT substrate ripple maps demonstrated that activation can be visually followed through the scar to identify these channels (Figure 4).19 Within these channels, we considered activation identified by RM to be genuine – rather than noise – when three closely neighbouring RM bars appeared on the map with similar timing. The appearance of sequential RM activation of three or more bars obviates the need to annotate LAT and identify propagation manually. By identifying conducting channels within scar using RM, bipolar voltage map thresholds can be reassessed on a patient-specific basis. At least one such channel was identified in all 18 patients studied. Sites of entrainment with concealed fusion, excellent pace maps and termination also co-located to such channels identified by RM, highlighting the heterogenous nature of scar architecture serving as the substrate for VT.19
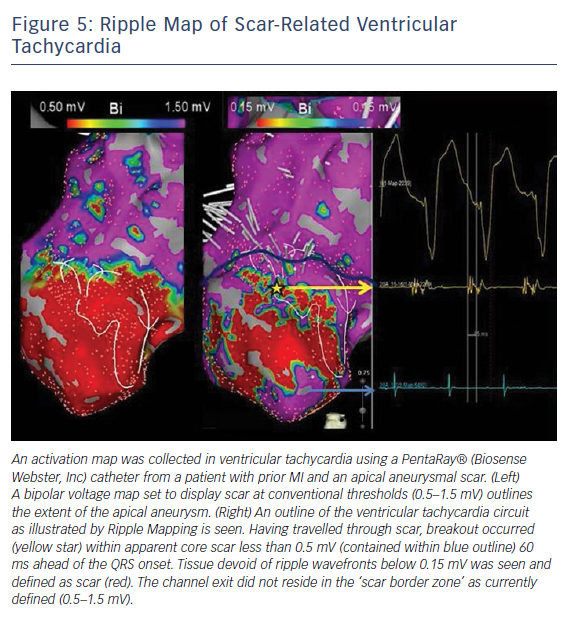
RM allows two distinct wavefronts to be seen on the cardiac surface, the far-field wavefront followed by the delayed local wavefront representing the potential channel within scar. Mapping with small tip, narrowly spaced multielectrode catheters can reduce the contribution of far-field signal. In doing so, wavefronts of ripple activation were appreciated even in tissue with activation as low as 0.15 mV, further challenging the universal bipolar voltage definition of ventricular scar as <0.5 mV.12 An example of this, when mapping in VT, is highlighted in Figure 5.
During sinus rhythm or ventricular pacing, clusters of ripple activation can be appreciated within scar. The direction of activation further characterised active scar into conducting channels. Convergent activation of scar towards its centre, via such channels, was clearly visible by RM. In a prospective study of 15 post-infarct patients, conducting channels within ventricular scar were identified in all patients and distinguished from far-field signal. Importantly, in patients where stable VT was mapped, the diastolic pathway co-located with channels mapped in sinus rhythm in all patients. Substrate ablation of these channels rendered 85 % of patients non-inducible for VT and 70 % free from VT at 6 months.12
There remain unanswered questions in VT RM. While the channel of slow conduction through the scar can be defined, the optimal strategy for ablation requires further study. Whether these channels within ventricular scar are anatomically fixed in location or functional – arising in regions of non-uniform anisotropy – is also not fully understood.
Future Direction
RM is a tool that preserves information from the EGMs on a map. We have discussed its use in complex arrhythmia, but it can offer multiple further potential uses: mapping of gaps within wide area circumferential ablation or linear lesions, documenting conduction block across linear lesions, determining the relationship between the endocardial and epicardial ventricular substrate and mapping the conduction system in His–Purkinje-related VT (fascicular tachycardia and bundle branch re-entry). In the case of AT, RM allows precise identification of the AT substrate in the scarred atrium. This may allow for substrate-guided ablation strategies, in sinus rhythm, for the treatment of AT. Early experiences demonstrate that RM is a promising technique.16